

Hierarchies Panel
This page describes how to work with the Hierarchies Panel.
- Overview of Hierarchies Panel
- Hierarchy Panel Drives Elements Panel
- Default Hierarchy of a Dimension
- Hierarchies Panel Functionality
- View Model Metadata
- Filter Hierarchies Panel by Measure Group
- Filter Hierarchies Panel by Free Text
- Customizing the Hierarchies Panel Appearance
NOTE: Before reading this page, we recommended that you read about Selection Panel (Basics) and Selection Panel (Techniques).
Overview of Hierarchies Panel
The hierarchies panel is an interactive tree that allows users to browse hierarchical structures within the data model. The hierarchies panel works interactively with the selection panel to allow users to select which dimensions, hierarchies and levels to include in the query. The user can place hierarchies in the selection panel using drop-and-drag functionality or by right-clicking and using context menus.
Hierarchy Panel Drives Elements Panel
The hierarchies panel acts as the "table of contents" for selecting which structure will be viewed in the Elements Panel. You just double-click on a hierarchy to add the hierarchy to the selection panel and display its elements. The elements panel allows you to select specific members from the hierarchy.
Default Hierarchy of a Dimension
Within a given dimension, the "default hierarchy" is defined as follows:
- The first user hierarchy (if there is one).
- The first attribute hierarchy.
Hierarchies Panel Functionality
The hierarchies panel allows you to work with dimensions, hierarchies and levels.
Using Dimensions
Dimensions are the highest level of structure in the data model.
- Opening a dimension displays a list of folders and hierarchies.
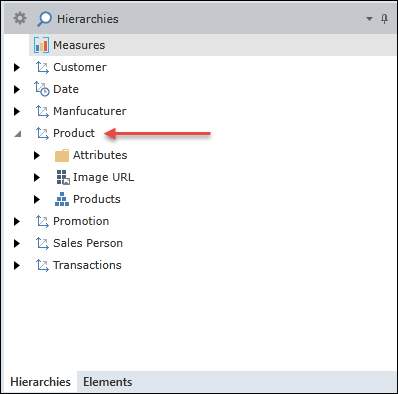
- Right-clicking a dimension displays the relevant context menus.
- The Measures dimension has a unique icon
 .
. - The Date dimension has a unique icon
 .
.
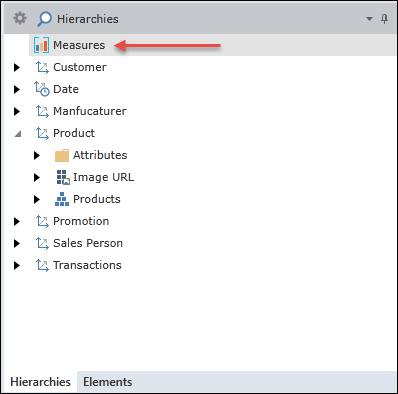
Using Measures
The Measures dimension behaves differently than the other dimensions.
- The Measures dimension is always present in the Selection Panel (it can be moved between zones but not deleted).
- The Measures dimension functions contains no subordinate hierarchies (it functions in the selection panel as a single hierarchy).
- Double clicking the Measures dimension displays the Elements Panel for Measures where you can view and select measures.
Using Hierarchies
Hierarchies represent an organization of member elements in a hierarchical tree of parent elements and their subordinate child elements. Dimensions may contain one or more hierarchies, where each hierarchy represents a different but related pathway through the dimension.
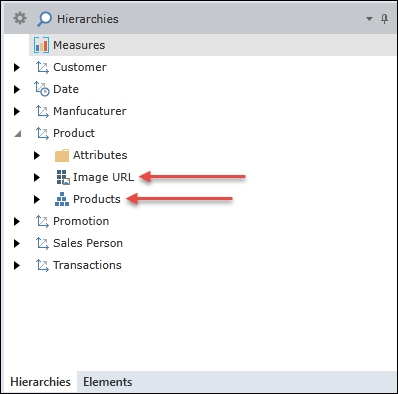
- User Hierarchies are denoted with a pyramid icon.

-
Attribute Hierarchies are denoted with a six-pack icon.

- Hierarchies are often pre-grouped into display folders by data model designers. If such folders are present, they can be opened to view their contents.
- Opening a hierarchy displays all its levels.
- Hierarchies can be drag-and-dropped into any of the four selection zones.
- Right-clicking any item accesses the relevant Context Menus.
- Double-clicking a hierarchy displays its Elements Panel.
- Double-clicking a hierarchy also adds it to the Selection Panel as follows:
- For multi-level user hierarchies, the first level (ALL) is ignored and the second level is used. Dragging the second level item directly into the selection panel has the same effect.
By default, hierarchies added via this double-click method are added to the ROWS of the query. However, if a sibling hierarchy from the same dimension tree is present in a different zone, the new hierarchy will be placed in the same zone as the sibling.
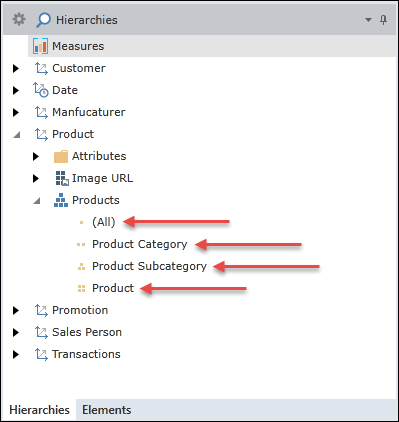
Using Levels
A level within a hierarchy represents a collection of all member elements belonging to the same level of lineage (regardless of parentage).
- Each level is denoted by an icon representing its level number within the tree


- Most hierarchies have an "ALL" level, but it is not required.
- Any individual level item can be dragged into one of the four zones.
- Right-click any level item to access Context Menus.
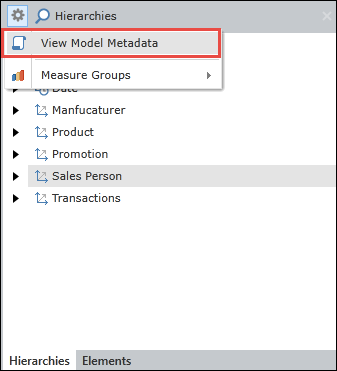
View Model Metadata
The user can view metadata for the data model, including definitions for all dimensions and measures. The metadata can also be exported to an RTF file.
1) Click commands icon ![]() at top left of hierarchies panel.
at top left of hierarchies panel.
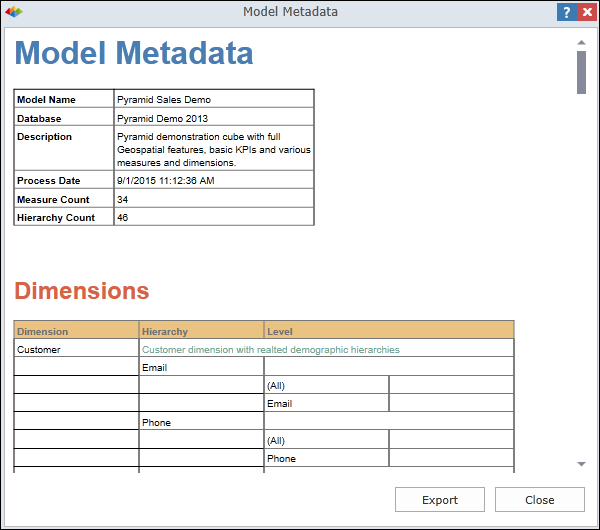
2) Select the View Model Metadata command.
3) The Model Metadata dialog appears, as shown below.
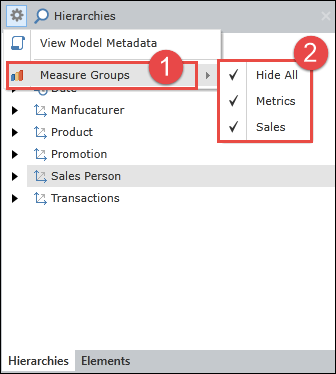
Filter Hierarchies Panel by Measure Group
The user can filter the hierarchies panel according to the different measure groups in the data model. This filter influences the current display, but is not saved as part of the report/book.
- Click commands icon
 at top left of hierarchies panel.
 - Select the Measure Groups command.
- You have three options:
- Hide All - Hide all hierarchies.
- Show All - Show all hierarchies.
- MEASURE GROUP NAMES - Select one or more of the measure group names.
Example
In this example, there are two measure groups named Metrics and Sales. The actual number of measure groups depends on the data model (there can be many).
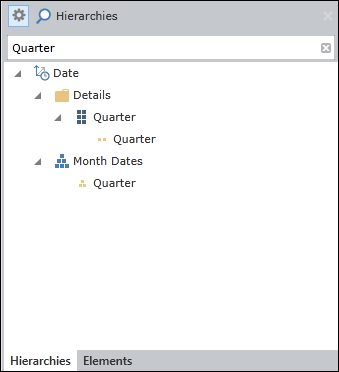
Filter Hierarchies Panel by Free Text
The user can type in free text for performing a quick search for matching items in the hierarchies panel. The search text influences the current hierarchies panel display, but is not saved as part of the report/book.
- Click the search icon.

- Type in any desired text.
Example
In this example, the user has typed in the text "Quarter" to find any items in the hierarchies panel whose name includes "Quarter".
Customizing the Hierarchies Panel Appearance
For information on controlling the appearance of the hierarchies panel, see Workspaces and Customize the Workspace.
Home |
Table of Contents |
Index |
User Community
Pyramid Analytics © 2011-2022